The Interdepartmental Equipment Facility
The FTIR Spectrometer.
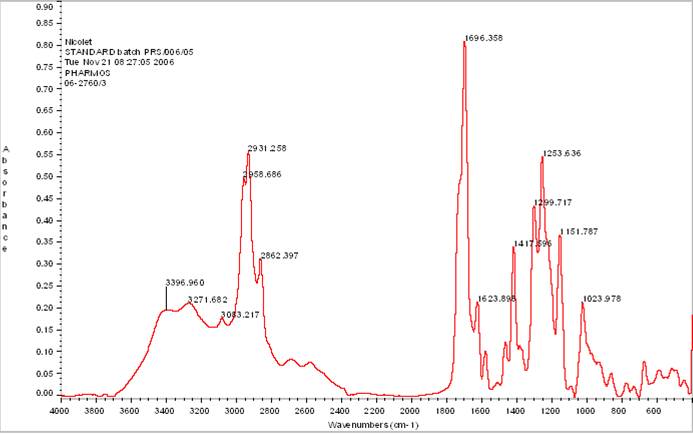
Infra-red spectroscopy probes the composition of a sample. Chemical bonds have characteristic frequencies at which they vibrate. They can be set on vibrations by illuminating the sample with Infra-Red light at the right frequency. The IR spectrum of a compound possessing such bonds shows absorption bands at these frequencies. The collection of different absorption bands can be used to identify the tested compound.
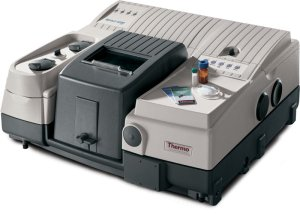
The Nicolet 6700 is a Spectrophotometer for the Mid-Infra-Red range. It can be used for several different tasks:
Absorbance Spectra are obtained by recording the absorbance as a function of wavelength.
Concentrations can be calculated from absorbance measurements at specific wavelengths, using a calibration curve constructed with standards.
Reaction rates can be monitored by recording changes in absorbance as a function of time.
Samples and Sample Holders
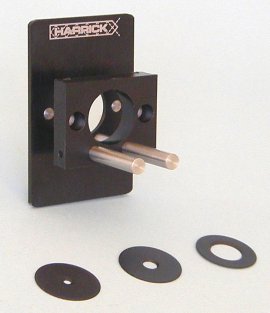
The sample compartment of the 6700 is located between the IR source on the right, and the detector on the left. Samples can be presented for analysis in a variety of forms:
Solid samples are usually ground with KBr and compressed to make pellets.
Liquid samples are tested in quartz cells or in special cells with salt windows
Thin plastic sheets can be presented for analysis with no further treatment.
Liquid samples, or solid samples dispersed in mineral oil, can also be spread as film between KBr windows. The samples are clamped in the sample holder, located in the middle of the sample compartment.
Preparing KBr Pellets
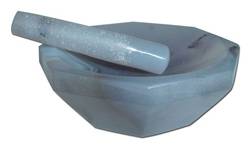
Crush about 100 mg of pure KBr to fine powder using an agate mortar and pestle. Add about 1 mg of the solid sample and grind it together with the KBR for several minutes until fully mixed.
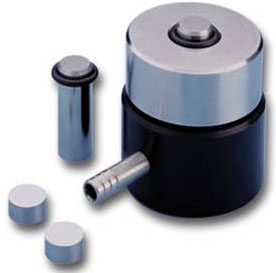
Assemble the Die set and add the mixture into the die; it goes between the two stainless-steel discs. Put the die into the press and follow instructions to prepare the KBr Pellet. A good KBr pellet is thin and transparent. Opaque pellets give poor spectra and white spots in a pellet indicate that the powder is not ground well enough, or is not dispersed properly in the pellets.
The ATR Accessory
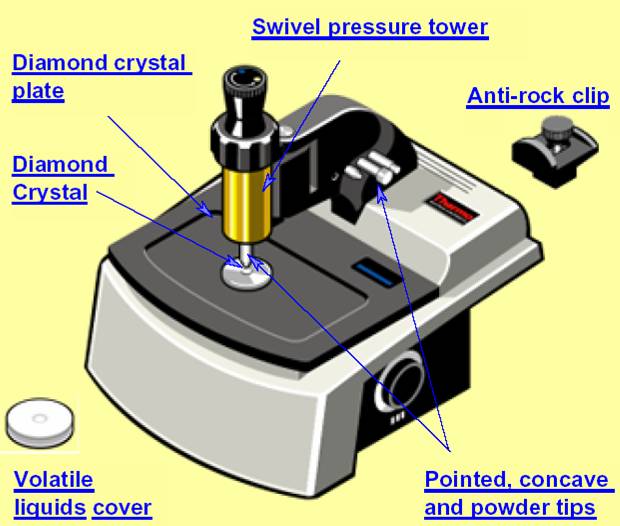
The use of ATR eliminates in many cases the need for sample preparation or at least simplifies the procedures .The ATR accessory fits in the sample compartment of the 6700. ATR, or Attenuated Total Reflectance is especially useful for strongly absorbing samples which cannot be measured by infrared transmission.
The IR beam, in this device, hits the interface with the sample at an angle greater than the critical angle, so that total internal reflection occurs. The internally reflected beam generates "evanescent waves" into the sample.
ATR works well for these samples because the intensity of the evanescent waves decays exponentially with distance from the surface of the ATR crystal, making the technique largely insensitive to sample thickness.
The DRIFT Accessory
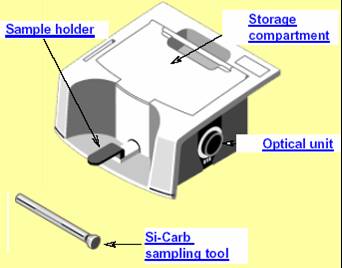
The DRIFT accessory fits snugly in the sample compartment of the 6700. DRIFT stands for Diffuse Reflectance Infra-red Fourier Transform. Diffuse Reflectance occurs when light impinges on the surface of a material and is partially reflected and partially absorbed.
The Drift Accessory is commonly used for the analysis of samples that can be ground into a fine powder (less than 10 microns) and mixed in a powder matrix such as KBr.
It can also be used for the analysis of surfaces. Silicon carbide paper disc can be used to rub off a small amount of paint of a sample surface, which is then presented for analysis using the DRIFT accessory.
Taking Measurements
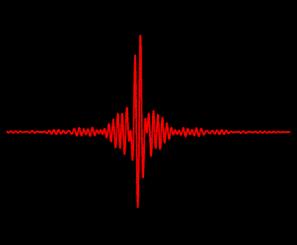
The Interferogram. The FTIR Spectrometer uses a Michelson Interferometer to obtain infrared spectra. The interferogram is generated by interfering the measuring beam with the reference beam.
The interferogram already contains the spectral information of the sample, but the information is not evident yet as data for the different wavelengths are superimposed on each other. In order to extract and present this information as an absorbance or transmittance spectrum the interferogram has to be Fourier transformed.
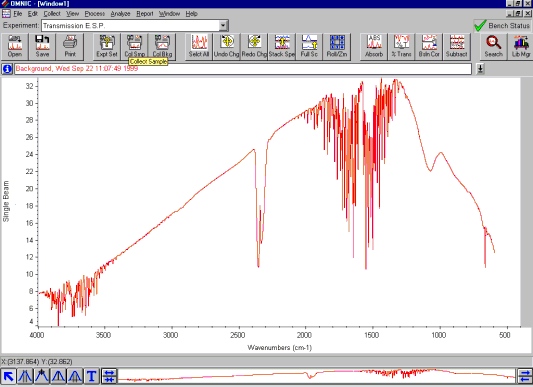
The Single Beam Spectrum. When an interferogram is Fourier transformed, a single beam spectrum is generated, presenting a plot of the IR signal versus wavelength. This is still not usable, as sample peaks are superimposed upon instrumental and atmospheric contributions to the spectrum.
To eliminate these contributions, a background spectrum, obtained without a sample, has to be measured first.
A background spectrum typically shows bands around 3500 cm-1 and 1630 cm-1 which are ascribed to atmospheric water vapor. The bands at 2350 cm-1 and 667 cm-1 are attributed to carbon dioxide. The sample spectrum must be normalized against this background spectrum.
The transmittance Spectrum. To normalize the IR measurements the single beam signal (I) is divided by the background signal (Io). The result is a %-transmittance spectrum ( as T = I/Io )
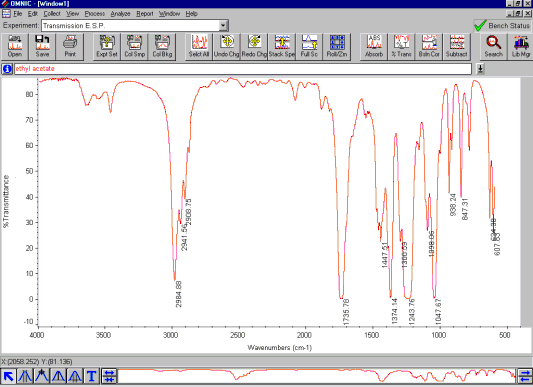
The absorbance Spectrum can now be calculated from the transmittance spectrum using the equation: A = -log T
